Around 12 months ago I asked on this board about tracking solar panels,
I have now completed test tracking 4 panels on an old tracker,
with encouraging results.
The system is 24v, the maximum output from the 4 test panels when
in a fixed position was 5.5 amps (7.3 amps when tracked)
with a combined rated wattage of 130.
The remaining fixed panels have a combined wattage of 1060
with peak output of 33.6 amps on the test days.
The test was done on two consecutive days, slight variations in
figures on the test group are due to my not having adjusted
the array for some time.
Most articles on tracking solar panels report an increased output of 30%
for tracked panels. In my test I found this to be correct at peak sun
but the overall increase was in the order of 100%.
The extra power is picked up on the shoulder periods, the tracked
array went to 64% output at first sun while the fixed panels took 2.5 hour
to reach 60%. Likewise at the end of the day the tracked array was at 33%
just prior to sundown while the fixed was at 2% and was at 30%
some 1.5 hours earlier.
I looked at the results as a percentage of possible full output
and amp-hours achieved on the day from each installation.
While I have not designed and costed the hardware side of new trackers
this will definatly be a Autumn project for me.
Its summer here(south west Australia) and maybe I will not have such gains in winter
as the sun is lower in the sky all day and the fixed array will be focused
for greater periods. My low power period is autumn when we usually
have sun but no winds.
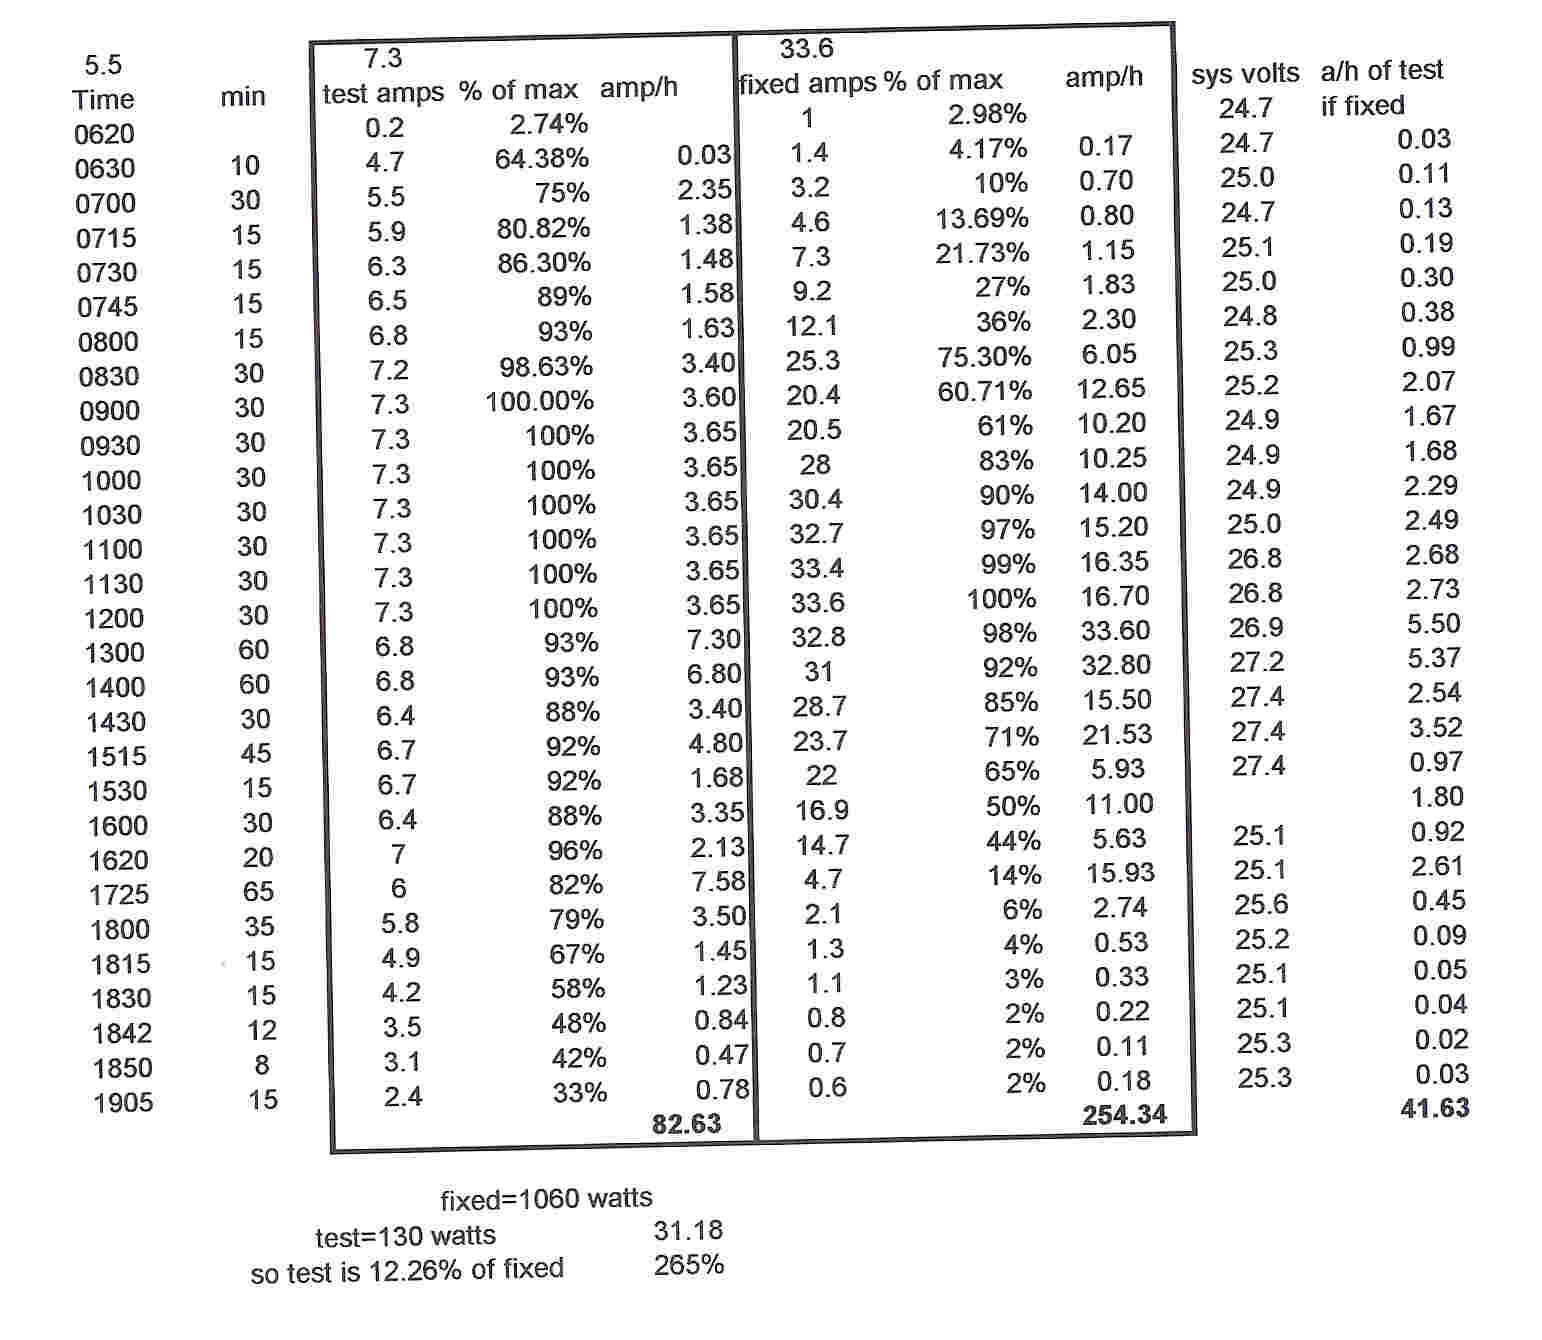
In the photo the columns are from left,
Time of day
Minuets in that period
Output amps of tracked array
Percentage of maximum possible output
Amp-hours
Fixed panels amps
Fixed panels percentage of possible output
Amp-hours
System volts
Amp-hours of tracked array if it was fixed using output percentage from other fixed arrays.