Author Topic: Windmill data logger  (Read 3729 times)

0 Members and 1 Guest are viewing this topic.

elt

  • Sr. Member
  • ****
  • Posts: 328
Windmill data logger
« on: November 17, 2007, 01:26:56 AM »
I built my anemometer (here - http://www.fieldlines.com/story/2007/10/22/23417/204) to see what my mill was doing in the wind.


Before the anemometer, I said that my mill was "very responsive" and tracked wind speed changes quickly. What I saw watching the winds peed is that it isn't that cut and dry. What I've learned is that while the mill does speed up quickly, the speed change typically lags a large change in wind speed by many seconds.


I built a little data logger so I could see in more detail. The little micro has uses two inputs for tachometer timing to measure wind speed and mill RPMs. It also senses ambient temperature and battery voltage and writes the values out a serial port.


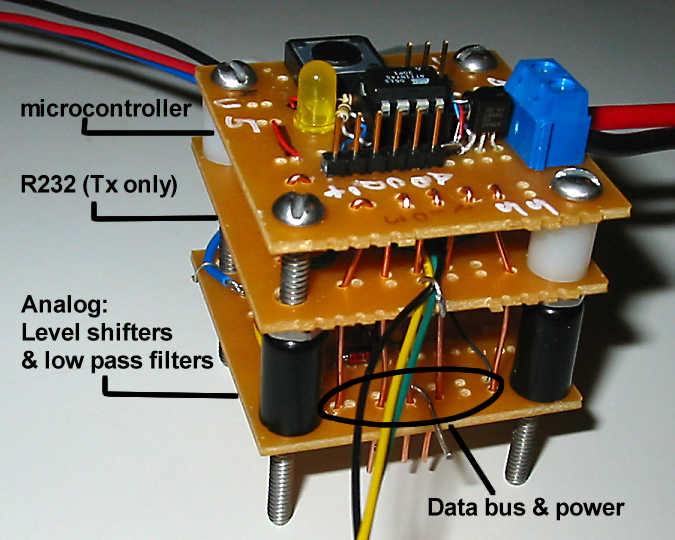
I connected the serial port to one of my "ZigBee" wireless development boards (which has a 2.4 GHz transceiver, microprocessor, buttons, LEDs and a UART)


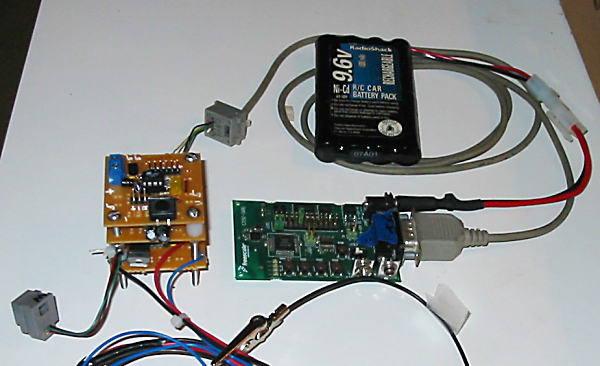
and connected another to a PC in the house.


I've futzed around a lot working to get the data into a database and am not there yet but I have put some of the data manually into a spread sheet and made a graph.


This graph shows data points every two seconds for about two and half minutes. At these speeds, the mill is unloaded. (Mill cut in is about 240 RPM.)


In this plot, the wind is gusting but in between gusts the mill RPM plot looks a lot like the wind MPH plot.


Gusts at about 15 seconds and 50 seconds shows about a 4 second lag in RPM response.


The gust at about 135 seconds shows about twice that lag; however, it appears mill still slowing from a previous peak and that the next gust just took a while to catch up with it. Strangely, the RPM peak at about 105 seconds seems to precede the wind peak but for now I'm just going to assume that that's an artifact of the 2 second sampling rate.


Interesting, but at this point I think that I'll end up with too much data to look at. Still, I'll will work on some "alarm" functions to let me know if something goes out of bounds. (And, truth be told, I'm having a blast making my own controls!)


 - Ed.

« Last Edit: November 17, 2007, 01:26:56 AM by (unknown) »

elt

  • Sr. Member
  • ****
  • Posts: 328
Re: Windmill data logger
« Reply #1 on: November 16, 2007, 08:34:47 PM »
Oh... here's the circuit I use for the mill tachometer input -


http://www.otherpower.com/images/scimages/6527/taco.GIF


Disclaimer: I'm not an electrical engineer!


Top to left: Connect to one of the phase outputs on the alternator. The first diode rectifies the AC, the resistor limits the current to the zener which limits the voltage seen by the microprocessor input pin. If I did it correctly, R1 and C2 also form a low pass filter.


The "taco" signal causes an interrupt in the microprocessor; the interrupt service routine records the time between pin changes in a circular queue; every two seconds the micro averages the times in the queue and sends it(and the temperature, battery voltage and wind speed recorded on other inputs) out its serial port to the transmitter.


 - Ed.

« Last Edit: November 16, 2007, 08:34:47 PM by elt »

DamonHD

  • Administrator
  • Super Hero Member Plus
  • *****
  • Posts: 4125
  • Country: gb
    • Earth Notes
Re: Windmill data logger
« Reply #2 on: November 17, 2007, 07:19:38 AM »
That output you have could also drive a pulse hardware counter which something like a laptop could sample periodically which is a bit lighter on the CPU.  My k8055 USB I/O card has a couple of inputs with counters for example.


Rgds


Damon


BTW, you possibly could dispense with D1 since the Zener will clamp the negative voltage fine, and a small resistor in the line to the microprocessor to minimise spikes, etc, would probably be kind.

« Last Edit: November 17, 2007, 07:19:38 AM by DamonHD »
Podcast: https://www.earth.org.uk/SECTION_podcast.html

@DamonHD@mastodon.social

elt

  • Sr. Member
  • ****
  • Posts: 328
Re: Windmill data logger
« Reply #3 on: November 17, 2007, 03:50:23 PM »
Hi Damon,


I've thought about putting a real computer in the mill shed but I don't want to power one. The data acquisition cube only draws 7 ma and the radio only 13 ma. Also, the pulses aren't really that fast (only a few hundred hertz in high winds) so the micro is idle most of the time and has plenty of cycles to spare.


> BTW, you possibly could dispense with D1


Thanks, I wasn't sure about that... I put the circuit in my simulator but didn't get results that made sense to me so I was just playing it safe.


 - Ed.

« Last Edit: November 17, 2007, 03:50:23 PM by elt »

elt

  • Sr. Member
  • ****
  • Posts: 328
Re: Windmill data logger
« Reply #4 on: November 22, 2007, 06:34:30 PM »
I worked out a little application to show the last 24 hours of data from the mill. Here are two screen shots -


The graph in the upper part of the screen is divided into two parts with a vertical line. The vertical line represents "now." To the left of it is today's data. To the right of it is yesterday's data. The line moves to the rights as time passes.


The text area shows the instantaneous data values (which are collected every two seconds.) I found a nice definition of "wind gust" at the NOAA website saying that it is the highest 3-second wind speed in a two minute interval so the application calculates that as well at a ten second average for the wind speed.


Even though cut in for the mill is about 12 MPH without the booster, you can see that even an average of about 8 MPH (at 3 am) is providing a little bit of charge to the batteries. The temperature is measure inside the mill shed (where the batteries are) and there's a little bump in the temperature chart (not shown) around 1 pm from the dump load running.


 - Ed.

« Last Edit: November 22, 2007, 06:34:30 PM by elt »

Boondocker

  • Full Member
  • ***
  • Posts: 193
Re: Windmill data logger
« Reply #5 on: November 22, 2007, 07:36:15 PM »
That is nice.   I work with a DCS that has a similar display.  It shows the trend rolling constantly across the screen.  The vertical line can be dragged to a time to view specific values or move to the front to display current conditions.
« Last Edit: November 22, 2007, 07:36:15 PM by Boondocker »

elt

  • Sr. Member
  • ****
  • Posts: 328
Re: Windmill data logger
« Reply #6 on: November 24, 2007, 07:33:36 AM »
That sounds like a nice feature...


BTW, I love your scatter plots and that prompted me to give one a try. I did TSR vs Wind speed


Design TSR of the blades is 7; I used a low station count in Alton's blade calculator so that I could carve them in Dan B's style. The mill cut-in is about 12 mph... data doesn't look to bad up there.


I was surprised at the high TSRs in low speeds but figure that much of that is rotor inertial keeps the blades spinning for a while when the wind dies down.


 - Ed.

« Last Edit: November 24, 2007, 07:33:36 AM by elt »