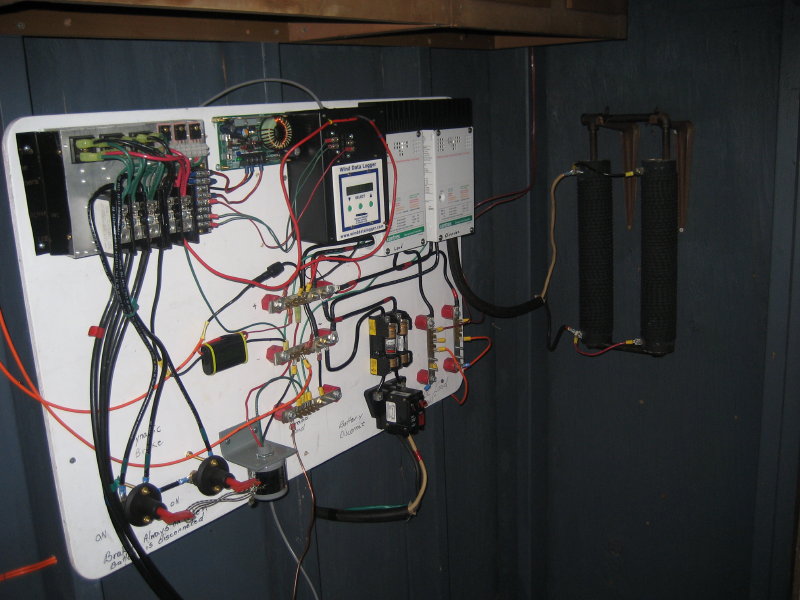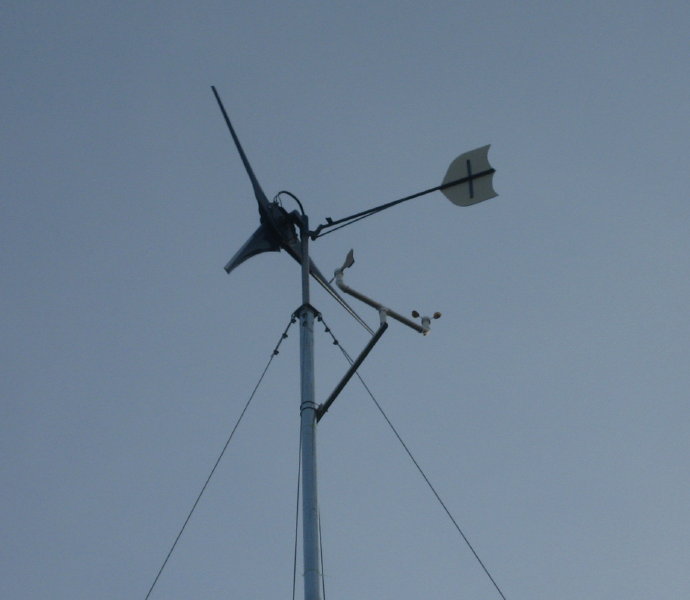
My turbine is located in a remote location and on my Dad's property on Beaver Island Michigan. To be able to collect data and monitor the performance of the turbine and wind conditions from afar I installed an anemometer and datalogger.
I admire the skill and electronic knowledge posted on this web site, especially ELT's endeavors. The method I pursued uses mostly "off the self components". I found a unit from ARPS that meet the requirements nicely. http://www.aprsworld.com/wind2/
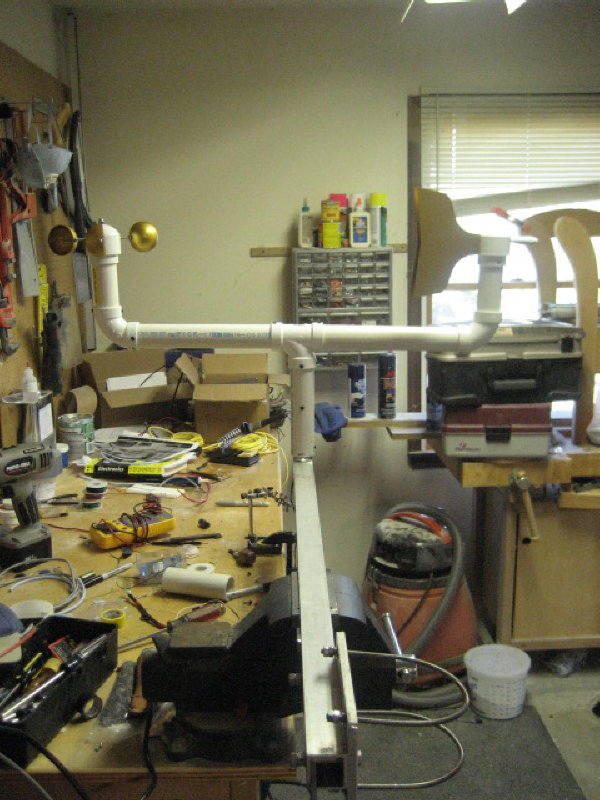
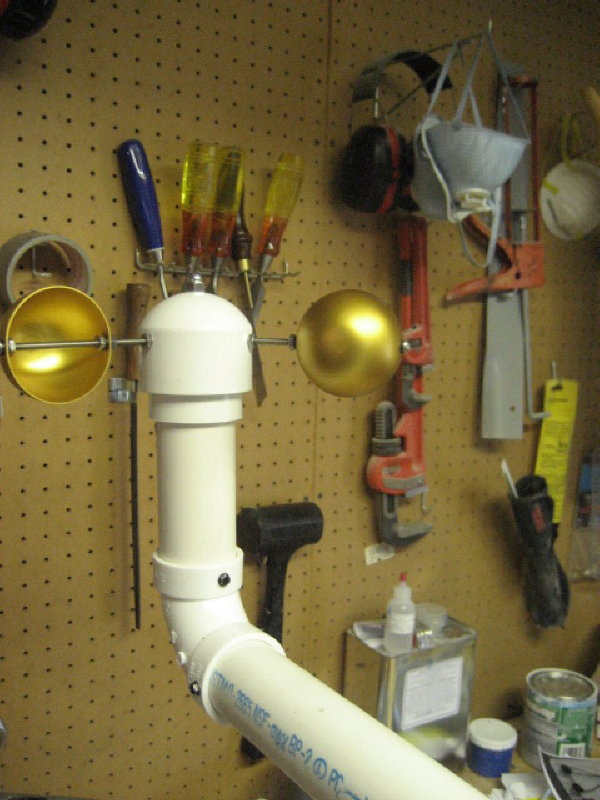
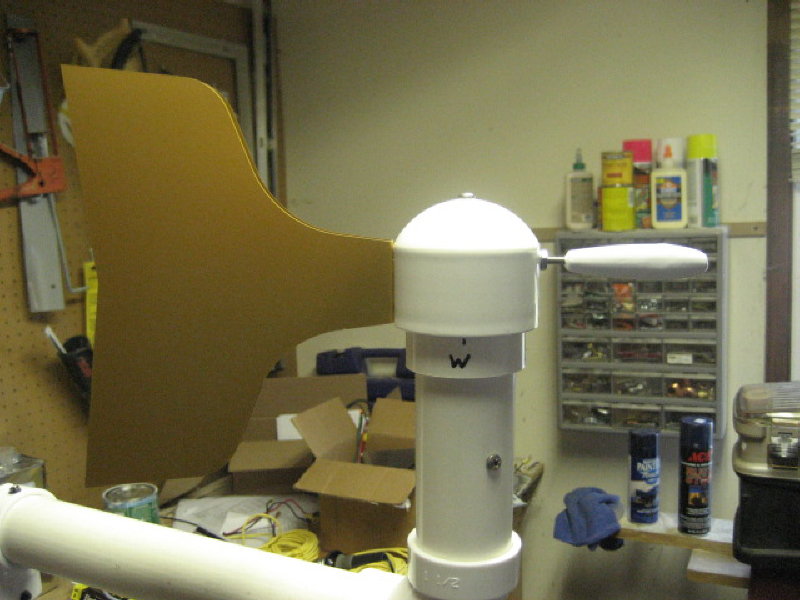
I purchased the kit versions and fabricated the tower mounting arm and bracket out SS and aluminum myself
The logger has the capability of having three anemometer and three analog inputs. I used the 2nd anemometer input to measure the wind turbine rpm. This was accomplished by "sniffing" the alternator AC frequency. A pulse is created by using diodes and protecting the circuit using an opto-coupler. The circuit is shown on BackshedShed DIY Windmills. http://www.thebackshed.com/windmill/PicLog.asp
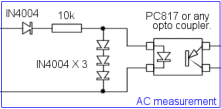
The logger configures each anemometer separately using a pulse and the basic y= mx + b formula to calculated a wind speed. So calculating the rpm from the pulse count out of a 12 pole alternator is easily done.
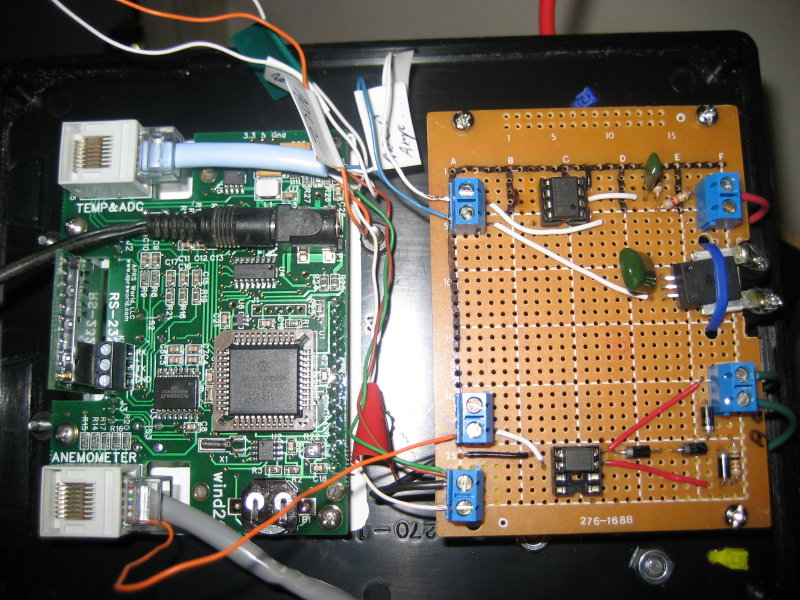
I also wanted to monitor amperage and dcv before boost and cut-in. For this I utilized the 0-5 dcv analog inputs. Current is measured using an Allegro Hall Sensor ACS752SCA-050. Before cut-in voltage is measured through a voltage divider and then passed through an op-amp for buffering and provide high voltage protection.
I placed the components on a proto broad and integrated the outputs to the logger's inputs as shown below. Then I calibrated and doubled check the inputs verifying they all worked properly before installing the equipment on site.
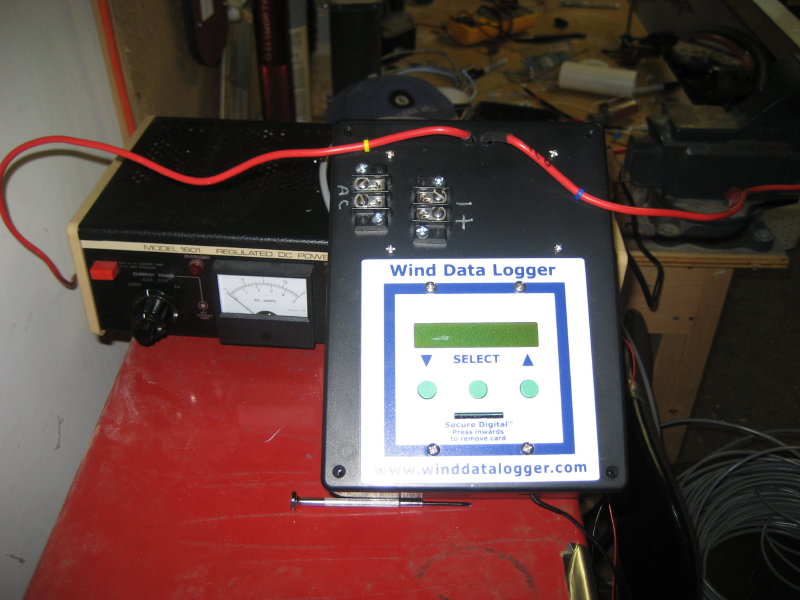
It works! Data is set-up to be recorded in 10 second interval (8640 reads/day) on a SD card which I transfer into an Excel Spread sheet. All the information of interest is there: time, wind speed, direction, Gust (10sec interval), Rpm , Max Rpm (10 sec interval), amperage, alternator dcv, system (battery) voltage.
It appears the display screen shows instantaneous values, it is very responsive to wind and rpm changes. What gets recorded is the reading at the end of a 10 second interval. So if winds are increasing or decreasing at the moment of the 10 second interval, it creates as spread range of the watts produced at that particular wind speed. Given a large sampling population of values, some meaningful performance values should be able to be inferred.
I'll post some data later on. Still working on the spreadsheet and making graphs.
