Author Topic: Logger Data  (Read 1424 times)

0 Members and 1 Guest are viewing this topic.

Boondocker

  • Full Member
  • ***
  • Posts: 193
Logger Data
« on: November 22, 2007, 03:52:24 PM »
Turbine Description Summary:


12 poles 9 coils

Magnets 1/4" Wedge (Windstuffnow)

Rotor plate 12" diameter 1/4" thick

Coils 51 turns two in-hand 15 awg wire

Wire in Star configuration

Stator phase resistance 0.36 ohms

Stator Thickness .50"

Air gap .77"

Blade diameter 2.8 meters carved to a 7 TSR

18 lbs of rotor thrust measure to furl while ground testing

Rotor off-set 5.0"


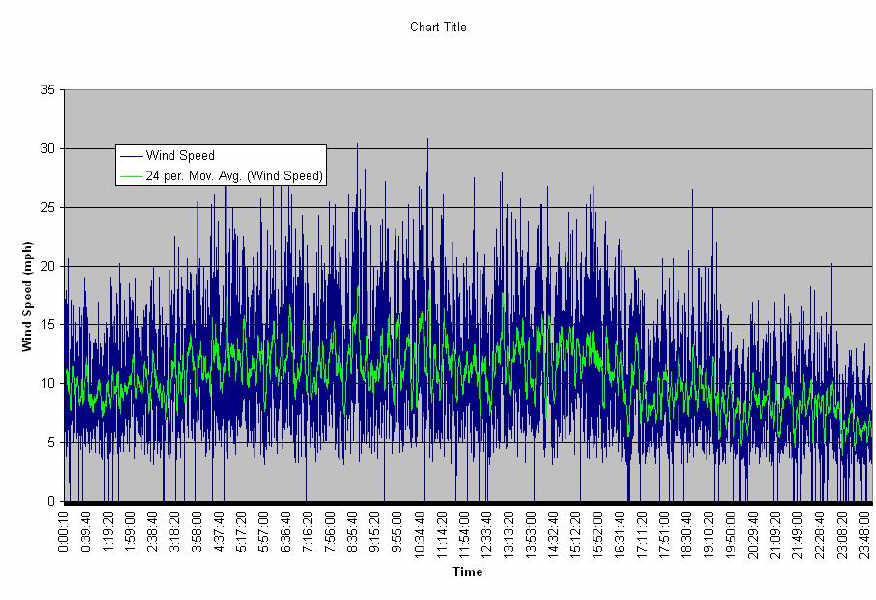
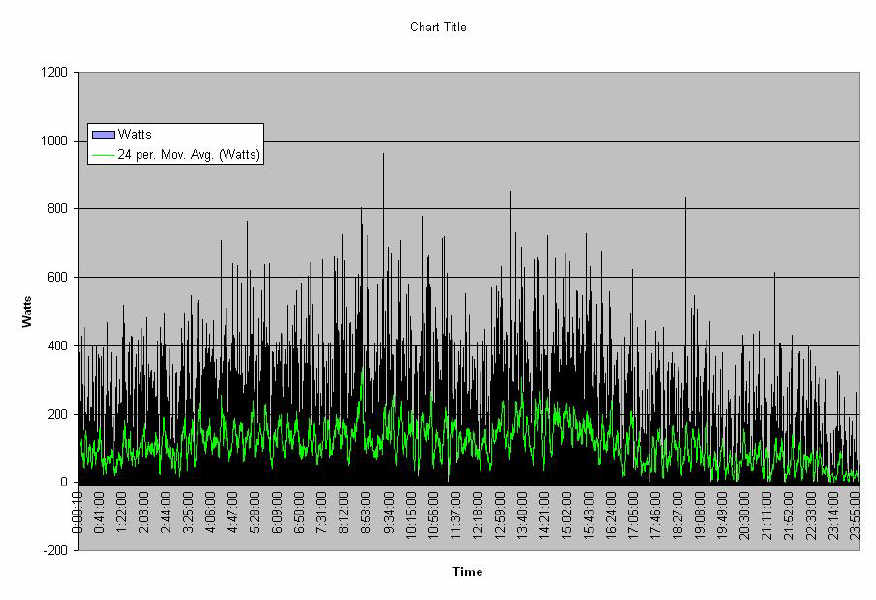
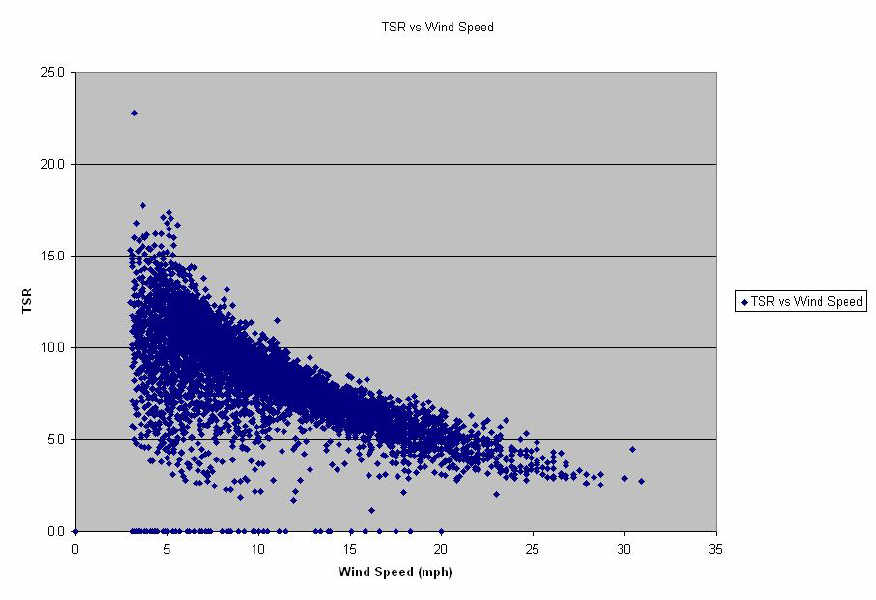
The graphs were created from one day's worth of data collected on a 10 second interval.  What I've found out that wind data is not very tidy.  On reason is how the logger records the information.   It saves the reading at the end of a 10 second interval.   So if the winds are increasing or decreasing at the interval moment it creates a spread in the watts reading produced at that particular wind speed.   The Excel spreadsheets used to create the graphs are in my files name 20071115g,   So you can look at better resolution graphs or play around with the data is you wish.  These graphs represent a "Windy" day.    The next diary post is of graphs of a less windy day.


Observations:


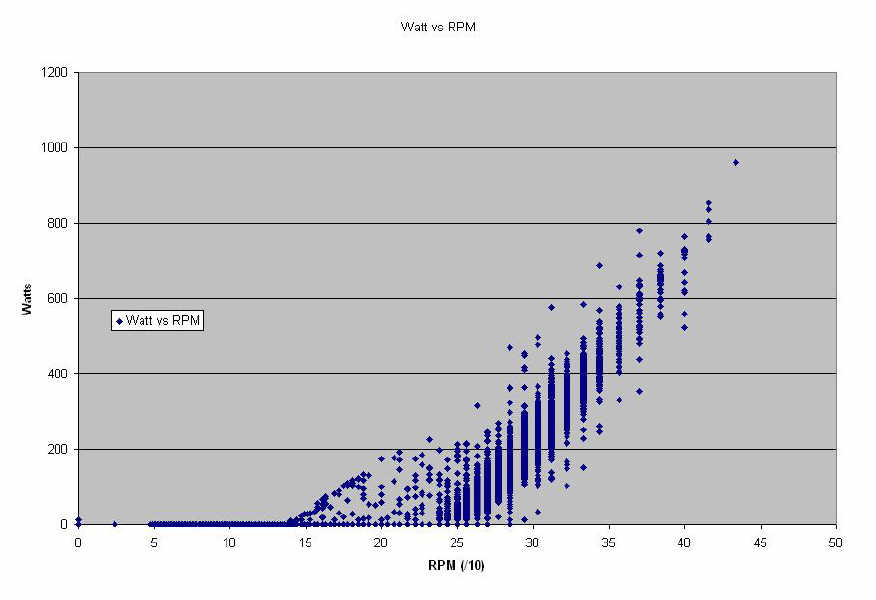
While watching the logger display I've seen the blade rpm will stay at 150 rpm until wind speed reach 5 to 6 mph.   When the winds are subsiding I've seen power still being made as low as a constant 4 mph.  The boost is active when the battery voltage is below 26.5 vdc.  Once the battery bank is charged to 26.5 vdc, the rpm will hang around 230 rpm until the wind get above 8 to 9 mph before making power.


On several occasions also have noticed, when the turbine is fully furl power will drop to zero.  It will not produce power again until the tail has dropped back down to the stops and the blades get back up to speed again.


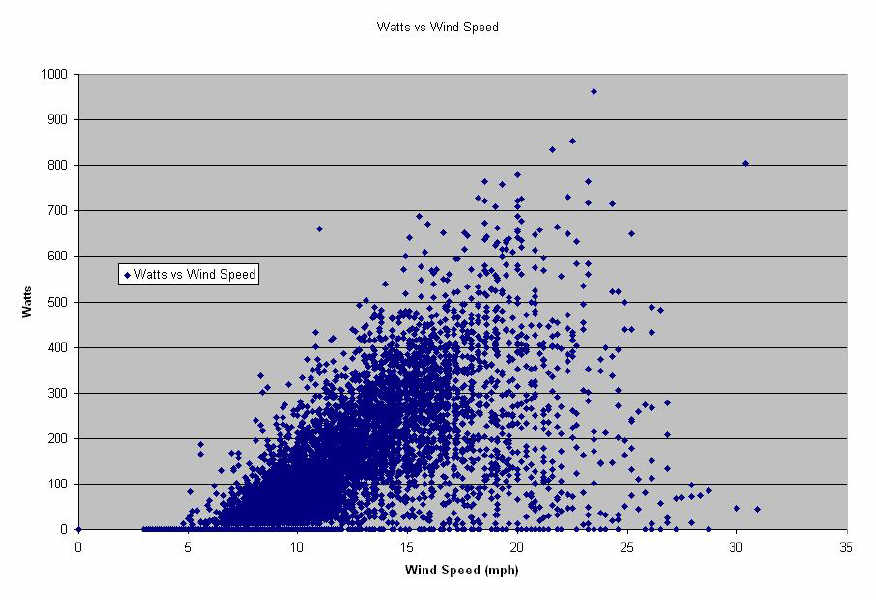
When the wind maintains between 8 to 12 mph is it just hums along nice and steady.  Until the winds get above 12 mph, from the ground it appears, the weather vane and the blade are not perpendicular.  It begins to furl around 15 mph.  Right now I believe making a slightly larger, and heavier tail, would optimize the turbine.


Overall I'm very satisfied with the performance.  In the lower winds I estimate the overall average system efficiency to be around 25 and 30%.  Also the diversion controller is dumping most of the time.

« Last Edit: November 22, 2007, 03:52:24 PM by (unknown) »

SparWeb

  • Global Moderator
  • Super Hero Member Plus
  • *****
  • Posts: 5448
  • Country: ca
    • Wind Turbine Project Field Notes
Re: Logger Data
« Reply #1 on: November 22, 2007, 12:49:45 PM »
Thanks for showing the data, I know it would have taken a while to sort it out into graphs and then turn them into something to share.  Thanks for going the extra mile.


These graphs illustrate a LOT of things about the behaviour of your wind turbine.  Almost as important as the averages, is the amount of scatter - obviously the factor that daunts most homebuilders trying to figure out why their mill is doing what it's doing.


« Last Edit: November 22, 2007, 12:49:45 PM by SparWeb »
No one believes the theory except the one who developed it. Everyone believes the experiment except the one who ran it.
System spec: 135w BP multicrystalline panels, Xantrex C40, DIY 10ft (3m) diameter wind turbine, Tri-Star TS60, 800AH x 24V AGM Battery, Xantrex SW4024
www.sparweb.ca

Flux

  • Super Hero Member Plus
  • *******
  • Posts: 6275
Re: Logger Data
« Reply #2 on: November 22, 2007, 03:03:03 PM »
Yes indeed. That is why you hardly ever see a power curve that you can believe. Just taking a few spot readings with an anemometer and looking at an ammeter doesn't give much idea. Try comparing two anemometers 10ft apart and you will see what problems there are.


If its any consolation the result look very similar to most other data I have seen.


I have collected large lengths of chart recorder traces that look very similar. You may find that on different days, winds from the same direction give very different data and some directions give far better power density than others.


Flux

« Last Edit: November 22, 2007, 03:03:03 PM by Flux »

Boondocker

  • Full Member
  • ***
  • Posts: 193
Re: Logger Data
« Reply #3 on: November 22, 2007, 04:21:35 PM »
"There are lies, damn lies, and statistics"


On the wind speed vs watts graph one could mark a line on the top side and declare an output of 200 watts in a 10 mph wind.   Conversely, place the line on the bottom side of the plots and say 200 watts at 15 mph.  50% increase in wind, or 30% decrease (looking downside change instead of the up), and it is possible to get the same output.  


Does make you wonder about the commercial wind turbines.  I can not image making a large purchase without a performance contract.

« Last Edit: November 22, 2007, 04:21:35 PM by Boondocker »