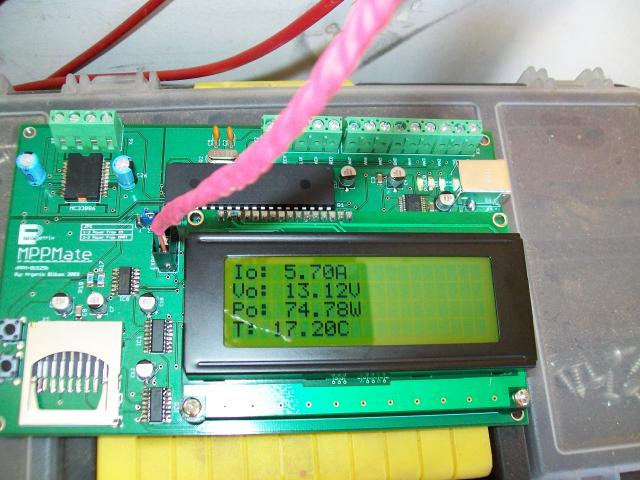
Ok, as I said before I materialized my data logger board that mates with my MPPT controller via the SPI port.
It logs data to an SD Card and the data can be extracted by reading the SD card in a computer or by connecting the data logger to a PC using the USB port.
So far it is logging great but I still have a few rough edges to chip out. I will do so when I get more time. I need to log input voltage and current.
Here are some pics:
Front:
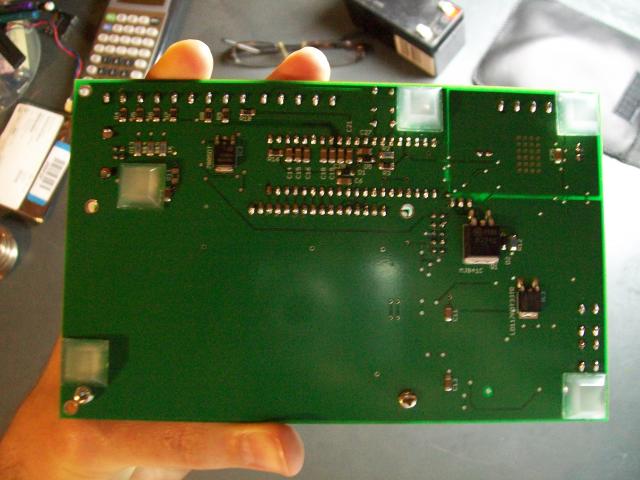
Back:
The complete setup:
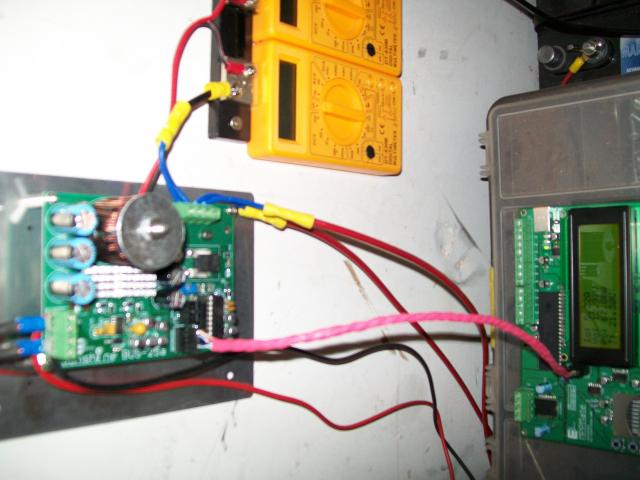
Obviously this is not where everything will ultimately go. I need to get a nice box and bolt everything nice and tight to the wall. But right now that is good enough while I finish adding features to the code and complete the debugging.
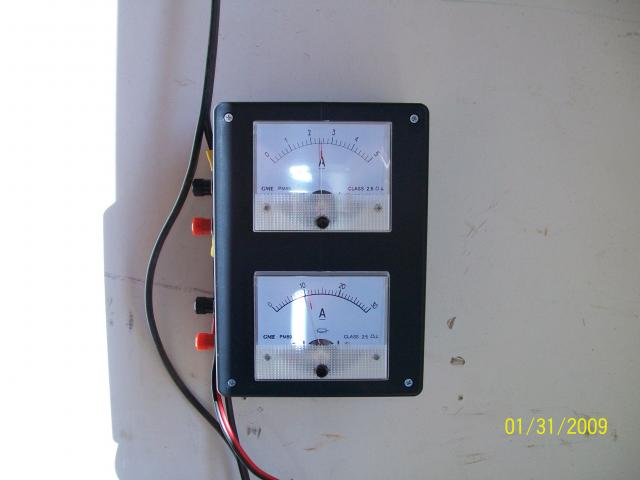
Meters measuring input current and Output Current:
On Feb 4th I used the data logger to sweep the PWM from 0 to 99% to get the real life VI curves for my complete setup, not just manufacturer's curves that often lie. I have in my roof 4x Harbor Freight panels in series + 4 first solar 50W panels for a total of 260W. As I have commented before my panels are not angled very nicely for this season but I see improvements every day as the sun moves back up to the sky. Here are the curves I got:
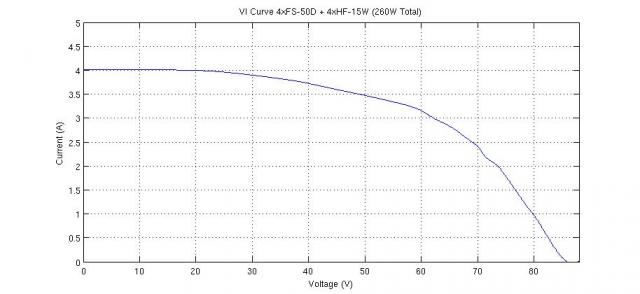
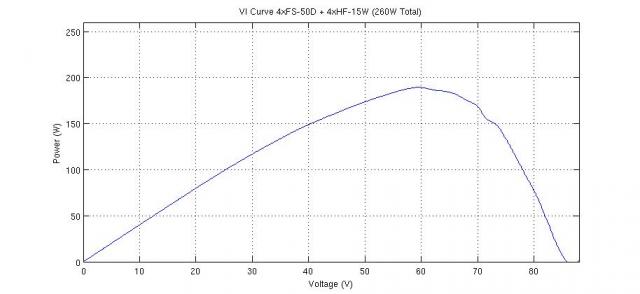
Luckily I am getting a bit more power than that now.
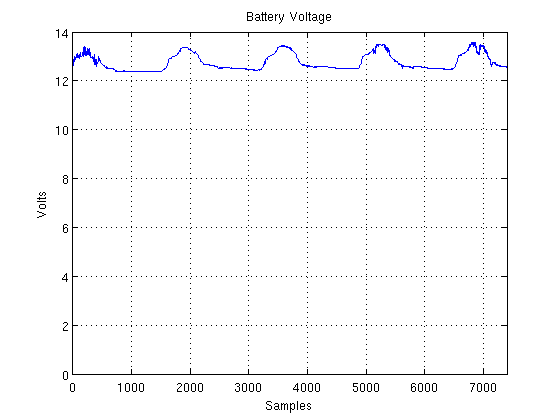
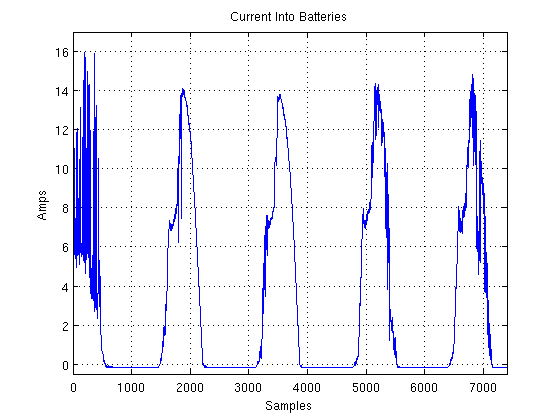
Now I show some of the data that I have grabbed starting Feb 23rd - Feb 27th (5 work days).
Battery Voltage:
Current Into Batteries:
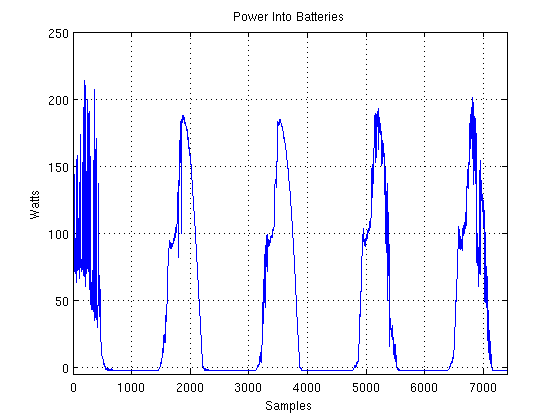
Power Into Batteries:
Converter Temperature:
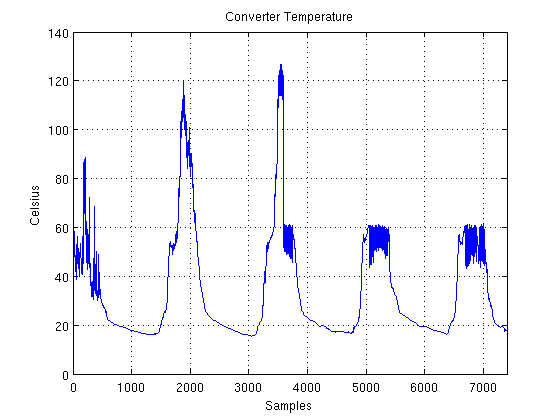
Now the last one is a very interesting one. At the beginning of the week I left the cooling fan disconnected to see if the MPPT controller would make it. It turns out that its thermally safe without a fan running at about 16Amps on the output. Though the temperatures are a bit high for my taste so I decided to put the fan back on by the third day at about mid day. As you can see the temperatures quickly went down to 60C and remained there. There after the temps never went over 60C with the fan on. This week has been very hot, about 28C during the day.
I am adding an excel spreadsheet with the data collected point by point:
Click Here for Spreadsheet
This data logger can do a lot more things than just log into the SD card. It also has an H bridge to control a 5A motor at any speed and direction in case that I want to play with a tracker some time. It also has 8 analog input to measure anything else I want to measure and record!
Those 5 days I got:
A total of 5811Watt/Hours
Max Power: 213.57W
Avg. Power: 40.2W
Max Current: 15.96A
Avg. Current: 3.15A
Max Voltage: 13.55V
Min Voltage: 12.35V
Avg. Voltage: 12.76V
Max Temp: 126.86C
Min Temp: 15.45C
