Author Topic: Collecting Data with PICLOG  (Read 4906 times)

0 Members and 1 Guest are viewing this topic.

SparWeb

  • Global Moderator
  • Super Hero Member Plus
  • *****
  • Posts: 5452
  • Country: ca
    • Wind Turbine Project Field Notes
Collecting Data with PICLOG
« on: May 04, 2008, 05:39:05 AM »
Hi,


I want to share on the forum the success I've had with my PICLOG.  Here are the plans for the device:


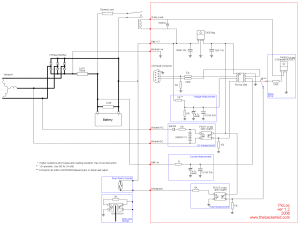
Click on the thumbnail to see the whole schematic (104kB, 1000 pixels wide)


The plans are found HERE.


Here's another Diary about using the PICAxe to collect data, from Jimovonz (he designed something similar himself):   http://www.fieldlines.com/story/2007/5/22/23153/8722


The PICLOG uses a "micro-controller" chip to receive and transmit data about the windmill.  The data is transmitted to a computer through its serial port.  I think I'll leave the details of how it works to the author; Glenn explains it very well.

Here is what my version looks like:


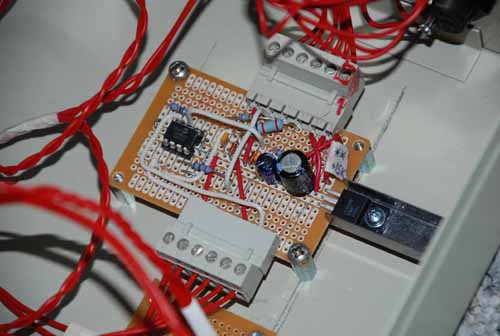
Yeah, there's lots of extra space in the box, but I didn't want it crammed, and who knows?  Maybe there's bigger and better in the future?


Here are pictures of the testing and calibration:


The anemometer is a story in itself!  This is the third iteration, the first two being too small to over come the stepper's "steps".  The stepper motor comes from a printer, and the blades are cut out of PVC pipe according to the Zubb-Woofer plan.  The anemometer was mounted on a pole for this truck-test (kinda hokey with bungee cords) and I stacked my multimeter and a GPS for correct speed on the dashboard.


The stepper motor wires are connected to a telephone extension cable, the jack for which can be recognized on the face of the PICLOG box below.


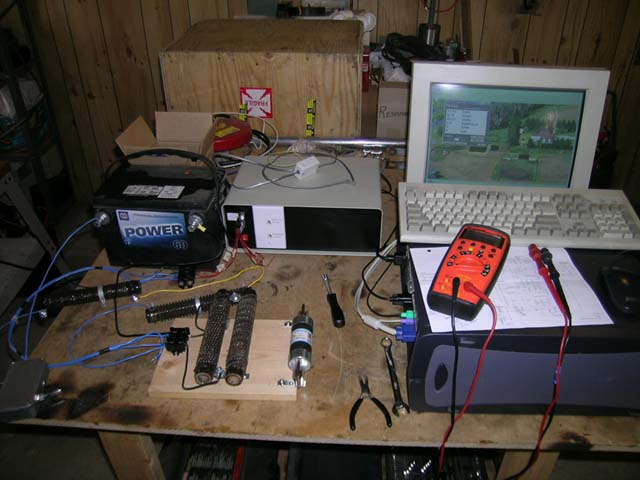
Here it is with a bunch of resistors acting as a load to calibrate it.  The resistors mounted as a pair are actually the Shunt, where the current is measured.

I did other calibration runs to have some reality checks on the RPM.  That's one thing that will take some work - not the fault of PICLOG, it's the low frequency of the alternator.


My early runs collecting data left me looking at a lot of scatter.  The obvious culprit was the RPM measurement (the bane of the motorconversions).  The frequency output is so low, that in one second the PICLOG can get 3 pulses, and in the next only 2, thus causing a 50% error.  To fix this, I increased the period over which the PICLOG counts the pulses to two seconds.  This may be enough, but while hand-turning the windmill the output still jumped around, so I may increase the period to 3 seconds.


What this does to the rest of the data is that the current measurement gets more weakly associated with the "instantaneous" RPM value.  That means for the same measured RPM, a different current will be read off, if the windmill is speeding up or slowing down in the preceding 2 seconds.


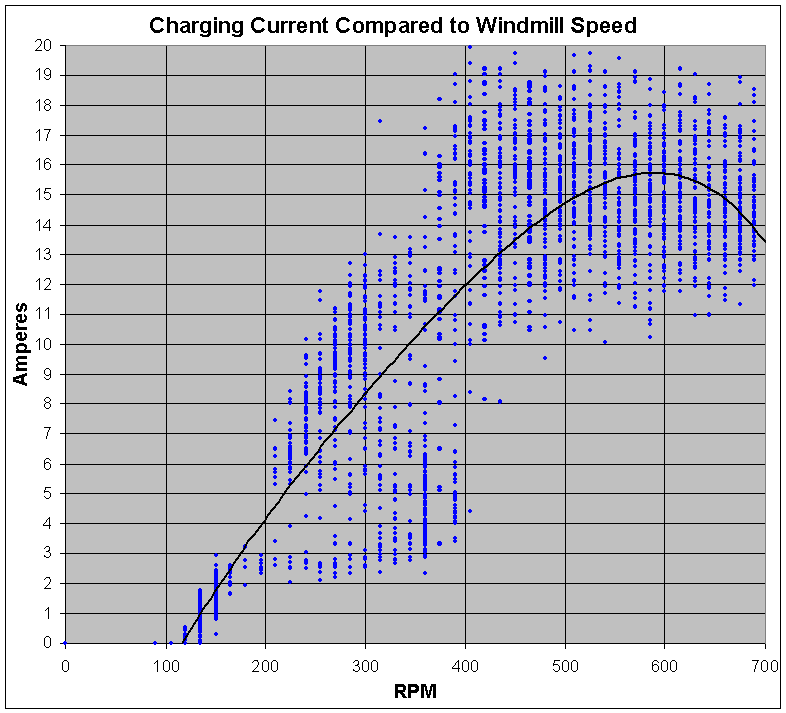
Well, close counts in horseshoes and windmill logs, so I'm still thrilled to see some reasonable data.  Here's a sample:


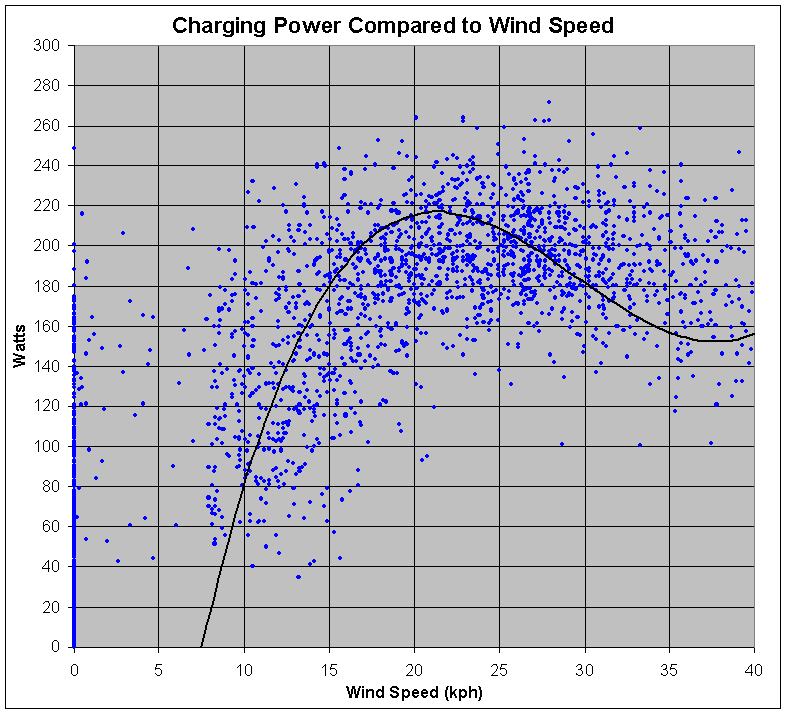
This is miles ahead of where I was last month, and I have Glenn to thank.  I also have Lforbes to thank for finding this for me.


Of most immediate importance: it's obvious now that the cut-in is pretty low, but the furling speed is rather high.  If the RPM measurements are to be trusted, I think the range of speeds the windmill experiences goes too far on both ends.  Re-wiring for parallel-star will probably improve performance over series-delta.  Maybe even parallel-delta will be worthwhile (HaHa I only made that remark to make Flux blink!  He's warned me about doing that already :-)


Bye for now

Steven

« Last Edit: May 04, 2008, 05:39:05 AM by (unknown) »
No one believes the theory except the one who developed it. Everyone believes the experiment except the one who ran it.
System spec: 135w BP multicrystalline panels, Xantrex C40, DIY 10ft (3m) diameter wind turbine, Tri-Star TS60, 800AH x 24V AGM Battery, Xantrex SW4024
www.sparweb.ca

DamonHD

  • Administrator
  • Super Hero Member Plus
  • *****
  • Posts: 4125
  • Country: gb
    • Earth Notes
Re: Collecting Data with PICLOG
« Reply #1 on: May 04, 2008, 02:32:35 AM »
Just from a quick quick glance at the circuit diagram I'd be concerned about getting enough reverse voltage across the opto-isolator input to cause something to break down.  I'd think about putting a reverse diode across the LED (it could be a signal diode if need be) to ensure that it can never see a large voltage.  Either that, or put some sort of high-value resistor network to distribute the reverse voltage the way you are expecting it to be divvied out.


Still, if it works, ignore me of course!


Rgds


Daon

« Last Edit: May 04, 2008, 02:32:35 AM by DamonHD »
Podcast: https://www.earth.org.uk/SECTION_podcast.html

@DamonHD@mastodon.social

Boondocker

  • Full Member
  • ***
  • Posts: 193
Re: Collecting Data with PICLOG
« Reply #2 on: May 04, 2008, 07:09:44 AM »
SparWeb,


Great work, especially doing it from scratch.   It is certainly nice to have information on how a turbine is performing.


The raw scatter plots are similar to ones I'm obtaining.   Ten minute averaging and overall averaging makes for a better presentation.  


Boondocker


« Last Edit: May 04, 2008, 07:09:44 AM by Boondocker »

bigkahoonaa

  • Jr. Member
  • **
  • Posts: 57
Re: Collecting Data with PICLOG
« Reply #3 on: May 04, 2008, 10:35:12 AM »
Hi SparWeb:


You may want to try pulsin instead of count if you need better RPM readings.  To get about 95% accuracy with count, you need a time interval that counts about 20 pulses.  This may not be an issue at high RPMs, but at low RPM your Picaxe could spend a lot of time doing nothing but counting pulses.  It's also possible to use a variable time interval for the count command.  I forget the details, but the math is not that complicated.  


Pulsin measures the width of a pulse in 10us steps.  You may need to add a flip-flop on your circuit, depending on the shape of your signal.   If you use pulsin to measure wind speed with the opto-vane you will definitely need a flip-flop.  I'm using Glenn's AC measurement circuit followed by a flip-flop on a genny that has 12 Neos per side.  I measure RPM with this code:


pulsin 7, 0, RPMAc

w0=RPMAc/100

RPMAc = 10000/w0


This code would need changing depending of the number magnets you have.  The only drawback is that pulsin will timeout after 0.65secs.  Running the Picaxe at 4MHz, I can only measure down to about 23 RPM.

« Last Edit: May 04, 2008, 10:35:12 AM by bigkahoonaa »

SparWeb

  • Global Moderator
  • Super Hero Member Plus
  • *****
  • Posts: 5452
  • Country: ca
    • Wind Turbine Project Field Notes
Re: Collecting Data with PICLOG
« Reply #4 on: May 04, 2008, 12:09:45 PM »
Thanks for bringing up the "pulsin" command.  I noticed it in the code jimovonz used, but didn't get around to looking it up in the PicAxe command reference book until now.  


...Now that I've read the description again, I'm concerned that measuring the length of the pulse will lead to different errors in the RPM.  When I modeled a genny with Spice, I found that there are significant periods of zero voltage in the waveform.


You might want to look at my previous diary, where I posted the Spice analysis, or perhaps at the oscilloscope readings that Peter Dingemans posted from his motor conversion a few months ago:

http://www.fieldlines.com/story/2008/2/29/153159/466


The pulsin command reads an accurate RPM only with a 50% duty cycle.


I have the piclog running again today with another change to the "count" command and I'll see if things are better.

« Last Edit: May 04, 2008, 12:09:45 PM by SparWeb »
No one believes the theory except the one who developed it. Everyone believes the experiment except the one who ran it.
System spec: 135w BP multicrystalline panels, Xantrex C40, DIY 10ft (3m) diameter wind turbine, Tri-Star TS60, 800AH x 24V AGM Battery, Xantrex SW4024
www.sparweb.ca

SparWeb

  • Global Moderator
  • Super Hero Member Plus
  • *****
  • Posts: 5452
  • Country: ca
    • Wind Turbine Project Field Notes
Re: Collecting Data with PICLOG
« Reply #5 on: May 04, 2008, 12:17:32 PM »
Hi Boondocker, that's what I'm aiming for, too.


I really like the wind Power Rose, hope you don't mind if I use the idea, too!


I realized this morning that I did not correct my wind speed for the height of the anemometer - it's only 6 feet off the ground so Watts-vs-Wind is a bit misleading.


I started to do the averaging, but it felt - i dunno - less honest?  The windmill's speed is really variable.  Pretending that over 10 seconds it's not going to change by a large amount, especially if the furling kicks in, seems to dilute the value of the data.


Haven't had a chance to really think through this stuff yet.  The focus has been on just getting the information in the first place!


Windy day to you!

« Last Edit: May 04, 2008, 12:17:32 PM by SparWeb »
No one believes the theory except the one who developed it. Everyone believes the experiment except the one who ran it.
System spec: 135w BP multicrystalline panels, Xantrex C40, DIY 10ft (3m) diameter wind turbine, Tri-Star TS60, 800AH x 24V AGM Battery, Xantrex SW4024
www.sparweb.ca

Boondocker

  • Full Member
  • ***
  • Posts: 193
Re: Collecting Data with PICLOG
« Reply #6 on: May 04, 2008, 12:21:29 PM »
Bigkahoonaa,


Did you find the pulse time between Hi and Low equal?  

« Last Edit: May 04, 2008, 12:21:29 PM by Boondocker »

DamonHD

  • Administrator
  • Super Hero Member Plus
  • *****
  • Posts: 4125
  • Country: gb
    • Earth Notes
Re: Collecting Data with PICLOG
« Reply #7 on: May 04, 2008, 12:28:01 PM »
Yes, but too much noise gets in the way of a human seeing what's really going on.


My feeling is to never discard the original data so that you can re-analyse it later/better, but filter/smooth/average for display.


BTW, I'm a big fan of median filtering (where you take a window of (say) the last 7 values and discard the top and bottom one or two values and use the middle one) since it cleanly dumps noise and all the values that you get out are real ones that went in.  That feels more 'honest' to me then inventing synthetic 'mean' values...


Rgds


Damon

« Last Edit: May 04, 2008, 12:28:01 PM by DamonHD »
Podcast: https://www.earth.org.uk/SECTION_podcast.html

@DamonHD@mastodon.social

SparWeb

  • Global Moderator
  • Super Hero Member Plus
  • *****
  • Posts: 5452
  • Country: ca
    • Wind Turbine Project Field Notes
Re: Collecting Data with PICLOG
« Reply #8 on: May 04, 2008, 12:30:58 PM »
Hi Damon,


I started writing a bunch of blah about the diodes, because I didn't understand you the first time.  Could something break down in the opto-isolator?  Can reverse voltage reach the opto?

« Last Edit: May 04, 2008, 12:30:58 PM by SparWeb »
No one believes the theory except the one who developed it. Everyone believes the experiment except the one who ran it.
System spec: 135w BP multicrystalline panels, Xantrex C40, DIY 10ft (3m) diameter wind turbine, Tri-Star TS60, 800AH x 24V AGM Battery, Xantrex SW4024
www.sparweb.ca

SparWeb

  • Global Moderator
  • Super Hero Member Plus
  • *****
  • Posts: 5452
  • Country: ca
    • Wind Turbine Project Field Notes
Re: Collecting Data with PICLOG
« Reply #9 on: May 04, 2008, 12:37:38 PM »
I see your point now.


I went back to the Fairchild 2N27 datasheet (the optocoupler I used).  There doesn't seem to be ANY Vr for the Anode-Cathode junction on the AC side of the optocoupler.  That's a worrying thought.  The only protection is the blocking diode on the one side.


I'll give it some more thought.  Not obvious on the diagram: I used 1N4002's instead of 1N4004's.  Which offer even less protection!

« Last Edit: May 04, 2008, 12:37:38 PM by SparWeb »
No one believes the theory except the one who developed it. Everyone believes the experiment except the one who ran it.
System spec: 135w BP multicrystalline panels, Xantrex C40, DIY 10ft (3m) diameter wind turbine, Tri-Star TS60, 800AH x 24V AGM Battery, Xantrex SW4024
www.sparweb.ca

Boondocker

  • Full Member
  • ***
  • Posts: 193
Re: Collecting Data with PICLOG
« Reply #10 on: May 04, 2008, 12:46:20 PM »
Should be able to check if the the duty cylcle is 50% by changing the state of the PULSIN command; no change mean 50/50. Could put in a correction factor multiplier, ratio the pulse Hi to the pulse Low time.
« Last Edit: May 04, 2008, 12:46:20 PM by Boondocker »

Boondocker

  • Full Member
  • ***
  • Posts: 193
Re: Collecting Data with PICLOG
« Reply #11 on: May 04, 2008, 01:18:24 PM »
SparWeb,

Use the power wind rose.  This project has sharpened my MS Excel skills.  Ross Wheeler has come-up with pretty neat wind rose.  Here is an adaptation:


« Last Edit: May 04, 2008, 01:18:24 PM by Boondocker »

bigkahoonaa

  • Jr. Member
  • **
  • Posts: 57
Re: Collecting Data with PICLOG
« Reply #12 on: May 04, 2008, 04:00:56 PM »
SparWeb and Boondocker


Very nice diagrams !


Reading RPM with pulsin shouldn't change with duty if you have a flip-flop chip on your signal line.  If you use pulsin without a flip-flop, you may get bizarre readings which could change with duty.  My poor attempt at a picture:


Without a flip-flop, pulsin will measure the width of a sine wave as T1.  A flip-flop is triggered high when the signal goes high, and will stay high until the signal goes high again.  Then it will stay low until the signal goes high again.  With a flip-flop, the measured time with pulsin is the length of a complete cycle, T2.  I have a simple sine wave in the diagram, but it does not matter how complicated the original signal may be.  Using pulsin with a flip-flop will measure the time for one complete cycle.


Big

« Last Edit: May 04, 2008, 04:00:56 PM by bigkahoonaa »

kurt

  • Hero Member
  • *****
  • Posts: 925
  • Country: us
    • website
Re: Collecting Data with PICLOG
« Reply #13 on: May 04, 2008, 06:20:45 PM »
it seems the image posting rules have totally gone out the window in this thread. it will stop immediately any further postings of images larger than 640 x 480 pixels or larger than 150MB will be removed no exceptions....
« Last Edit: May 04, 2008, 06:20:45 PM by kurt »

bigkahoonaa

  • Jr. Member
  • **
  • Posts: 57
Re: Collecting Data with PICLOG
« Reply #14 on: May 04, 2008, 09:02:33 PM »
Sorry about the size of that image, but it's really not that big (597 x 499 pixels, 42KB).  The original image is here: flip_flop. It previewed fine but came out ginormus.

« Last Edit: May 04, 2008, 09:02:33 PM by bigkahoonaa »

SparWeb

  • Global Moderator
  • Super Hero Member Plus
  • *****
  • Posts: 5452
  • Country: ca
    • Wind Turbine Project Field Notes
Re: Collecting Data with PICLOG
« Reply #15 on: May 05, 2008, 12:24:25 PM »
Bigkahoona,

You mentioned the flip-flop in your original suggestion, but the implication slipped by me.  Thank you for explaining that, too.  It sounds like I could swap a new circuit board in place of the existing RPM opto-coupler and that would be that.


Any recommendations for a flip-flop IC?


BTW, you can open up your "file uploads" page, and delete the first flip-flop diagram, to make this thread display better.  Kurt would appreciate it, too.


Later, you can then upload the correctly sized version back among your uploaded files.  Make the replacement file name EXACTLY the same as it was before, and the HTML on this page will find the changed file and display it.


And even if your attempt totally screws up, it's only one diagram that will not display, everything else will work fine.  I've seen the diagram, get your idea, and I'm glad you went to the trouble of drawing it just to illustrate your point.


Thanks!

« Last Edit: May 05, 2008, 12:24:25 PM by SparWeb »
No one believes the theory except the one who developed it. Everyone believes the experiment except the one who ran it.
System spec: 135w BP multicrystalline panels, Xantrex C40, DIY 10ft (3m) diameter wind turbine, Tri-Star TS60, 800AH x 24V AGM Battery, Xantrex SW4024
www.sparweb.ca

bigkahoonaa

  • Jr. Member
  • **
  • Posts: 57
Re: Collecting Data with PICLOG
« Reply #16 on: May 05, 2008, 09:58:02 PM »
Hi Steven:


I deleted the offensive image from my files, but it doesn't seem to make much difference in the format of your diary.  I've renamed it with just a tag, here.


I looked at different ways of measuring RPM with a Picaxe, and using pulsin and a flip-flop appears to work well.  It may give you a better correlation with current.


You don't need to scrap your circuit.   Take the output signal from the opto and send it to the CLOCK pin of a flip-flop chip.  Any logic level flip-flop, like a 4013B, should work ok.  The Picaxe pin needs to go to Q1.  The not Q1 pin goes back to the DATA pin on the flip-flop.  The SET and RESET pins are not needed and should be tied to ground.  Add a +5V source to the VDD pin, ground to VSS, and you're done.  You may need to add a pull-down resistor (about 10K) tying the opto pin to ground, and another pull-down tying the Picaxe pin to ground.  You may also need to experiment a bit, depending on your setup.


Big

« Last Edit: May 05, 2008, 09:58:02 PM by bigkahoonaa »

SparWeb

  • Global Moderator
  • Super Hero Member Plus
  • *****
  • Posts: 5452
  • Country: ca
    • Wind Turbine Project Field Notes
Re: Collecting Data with PICLOG
« Reply #17 on: May 09, 2008, 12:07:01 PM »
I'm having some success using a program based on the "pulsin" command over the "count" command.  I'm trying it first without a flip-flop.  I will post later with a comparison of the two sets of data.

« Last Edit: May 09, 2008, 12:07:01 PM by SparWeb »
No one believes the theory except the one who developed it. Everyone believes the experiment except the one who ran it.
System spec: 135w BP multicrystalline panels, Xantrex C40, DIY 10ft (3m) diameter wind turbine, Tri-Star TS60, 800AH x 24V AGM Battery, Xantrex SW4024
www.sparweb.ca