Test Equipment and Procedures
Data Acquisition
Data were acquired and processed from up to 60 surface pressure taps, three individual tunnel pressure transducers, and an angle of attack potentiometer. The data acquisition system included an IBM PC compatible 80386 based computer connected to a Pressure Systems Incorporated (PSI) data scanning system.
The PSI system included a 780B Data Acquisition and Control Unit (DACU), 780B Pressure Calibration Unit (PCU), 81-IFC scanning module interface, two ESP-32 5-psid range pressure scanning modules (ESPs), and a 30-channel Remotely Addressed Millivolt Module (RAMM-30).
Three individual pressure transducers read tunnel total pressure, tunnel east static pressure, and tunnel west static pressure. Before the test began, these transducers were bench calibrated using a water manometer to determine their sensitivities and offsets. Related values were entered into the data acquisition and reduction program so the transducers could be shunt resistor calibrated before each series of wind tunnel runs.
The angle of attack potentiometer was a linear rotary potentiometer and was regularly calibrated during the tunnel pressure transducers shunt calibration. The angle of attack calibration was accomplished by taking voltage readings at known values of set angle of attack. This calibration method gave angle of attack
readings within ±0.25° of actual over the entire angle range.
Two ESPs were calibrated simultaneously using the DACU and PCU. At the operator's request, the DACU commanded the PCU to apply known regulated pressures to the ESPs and read the output voltages from each integrated pressure sensor. From these values, the DACU calculated the calibration coefficients and stored them internally until the coefficients were requested by the controlling computer. This calibration was done several times during a run set because the ESPs were installed inside the model and their outputs tended to drift with temperature changes during a test sequence. Frequent online calibrations minimized the effect.
Finally, at the operator's request, pressure measurements from the airfoil surface taps and all other channels of information were acquired and stored by the DACU and subsequently passed to the controlling computer for final processing.
Data Reduction
The data reduction routine was incorporated as a section of the data acquisition program. This combination of data acquisition and reduction routines allowed data to be reduced online during a test. By quickly reducing selected runs, integrity checks could be made to ensure the equipment was working properly and to enable timely decisions about the test matrix.
The ambient pressure and tunnel air temperature were manually input into the computer and were updated regularly. These values, as well as the measurements from the tunnel pressure transducers, were used to calculate tunnel airspeed. As a continuous check of readings, both the tunnel individual pressure transducers
and the ESPs, read the tunnel total and static pressures.
A typical datum point was derived by acquiring twenty data scans of all channels over a 1-second window at each angle of attack and tunnel condition. The reduction portion of the program processed each data scan to coefficient forms Cp, Cl, Cm¼, and Cdp using the measured surface pressure voltages, calibration coefficients, tap locations and wind tunnel conditions. All scan sets for a given condition were then ensemble averaged to provide one set. All data were saved in electronic form. The data were not corrected for any tunnel wall effects, etc.
Test Matrix
The test was designed to allow an extended angle of attack range of -60° to 230° and Reynolds numbers of 1, 1.5, and 2 million with and without LEGR. Tabular data in Appendix B contains the actual Reynolds number for each angle of attack. The angle of attack increment was four degrees when <-20° or >40°, two degrees when -20°< <10° or 20°< <40°, and one degree when 10°< <20°. All test speeds and angles of attack were set for model clean and LEGR conditions.
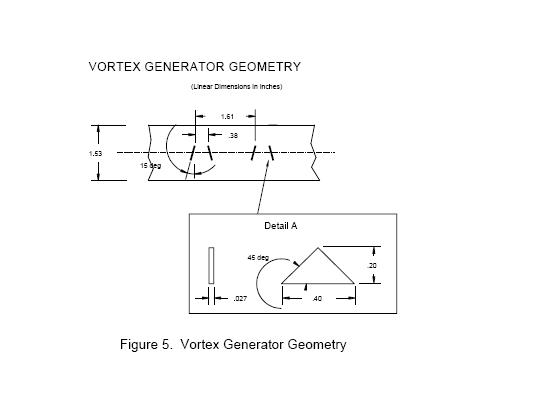
For some cases, VGs were mounted at the 30% chord position on the model's upper surface only. The VG strips were provided by U.S. Windpower and were the exact type used on wind turbines in the field. Test conditions while the VGs were applied included clean and LEGR data at 1 and 1.5 million Reynolds numbers
over an angle of attack range of -20° to 40°.
Summary
A NACA 4415 model was installed in the OSU/AARL 7x10 subsonic wind tunnel and tested at three Reynolds numbers and with model clean, roughened, and with VGs. Table 1 is a summary of the aerodynamic coefficient data for the NACA 4415.
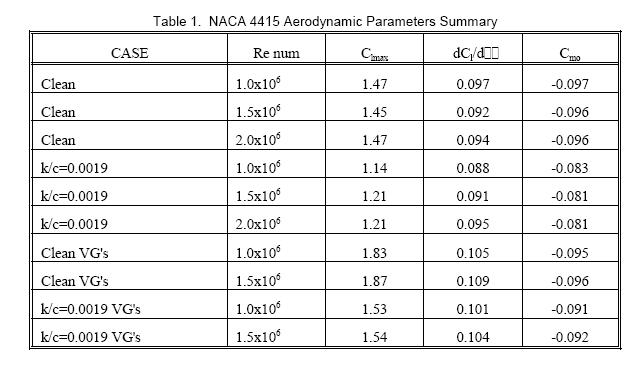
For the clean NACA 4415 model, Reynolds number changes from 1 to 2 million did not have a significant effect on the maximum positive lift or the pitching moment at zero degrees angle of attack. However, the addition of leading edge grit roughness to the model reduced the maximum lift coefficient by 18% and caused a 16% change in the pitching moment at 0° angle of attack. Also, the lift curve slope showed
increases with Reynolds number. Adding VGS on the model upper surface at the 30% chord station caused the maximum lift coefficient to increase by 29% in the clean cases and about 27% for the roughened cases.
The VGs apparently energized the boundary layer sufficiently to increase the lift curve slope and to delay stall to a higher angle of attack resulting in a higher maximum lift coefficient. However, the positive stall with VGs was more abrupt than the stall without VGs.
